Stress-testing the Resilience of the Austrian Healthcare System Using Agent-Based Simulation
Graz University of Technology | Complexity Science Hub Vienna
Jana Lasser | jana.lasser@tugraz.at | @janalasser
Motivation
Resident doctors can be hard to find
aging population (retirement)
rural depopulation
short-term shocks (COVID-19)
Which regions and specialisations are
most at risk of severe shortages?

Image credit: Yurii Karvatskyi
Naive approach
Counting doctors per patient and region.
Issues with this approach:
heterogeneous doctor capacity
heterogeneous doctor distribution & accessibility
different scenarios: fast (COVID) vs. slow (retirement) shocks
More sophisticated approach
Encode accessibility and distribution of doctors in a patient sharing network and simulate patient dynamics for different scenarios.
Assumptions:
When patients loose their doctor, they are more likely to go to a doctor they had already visited in the past.
When patients don't find a doctor for a long time, they "drop out" of the (resident) healthcare system.
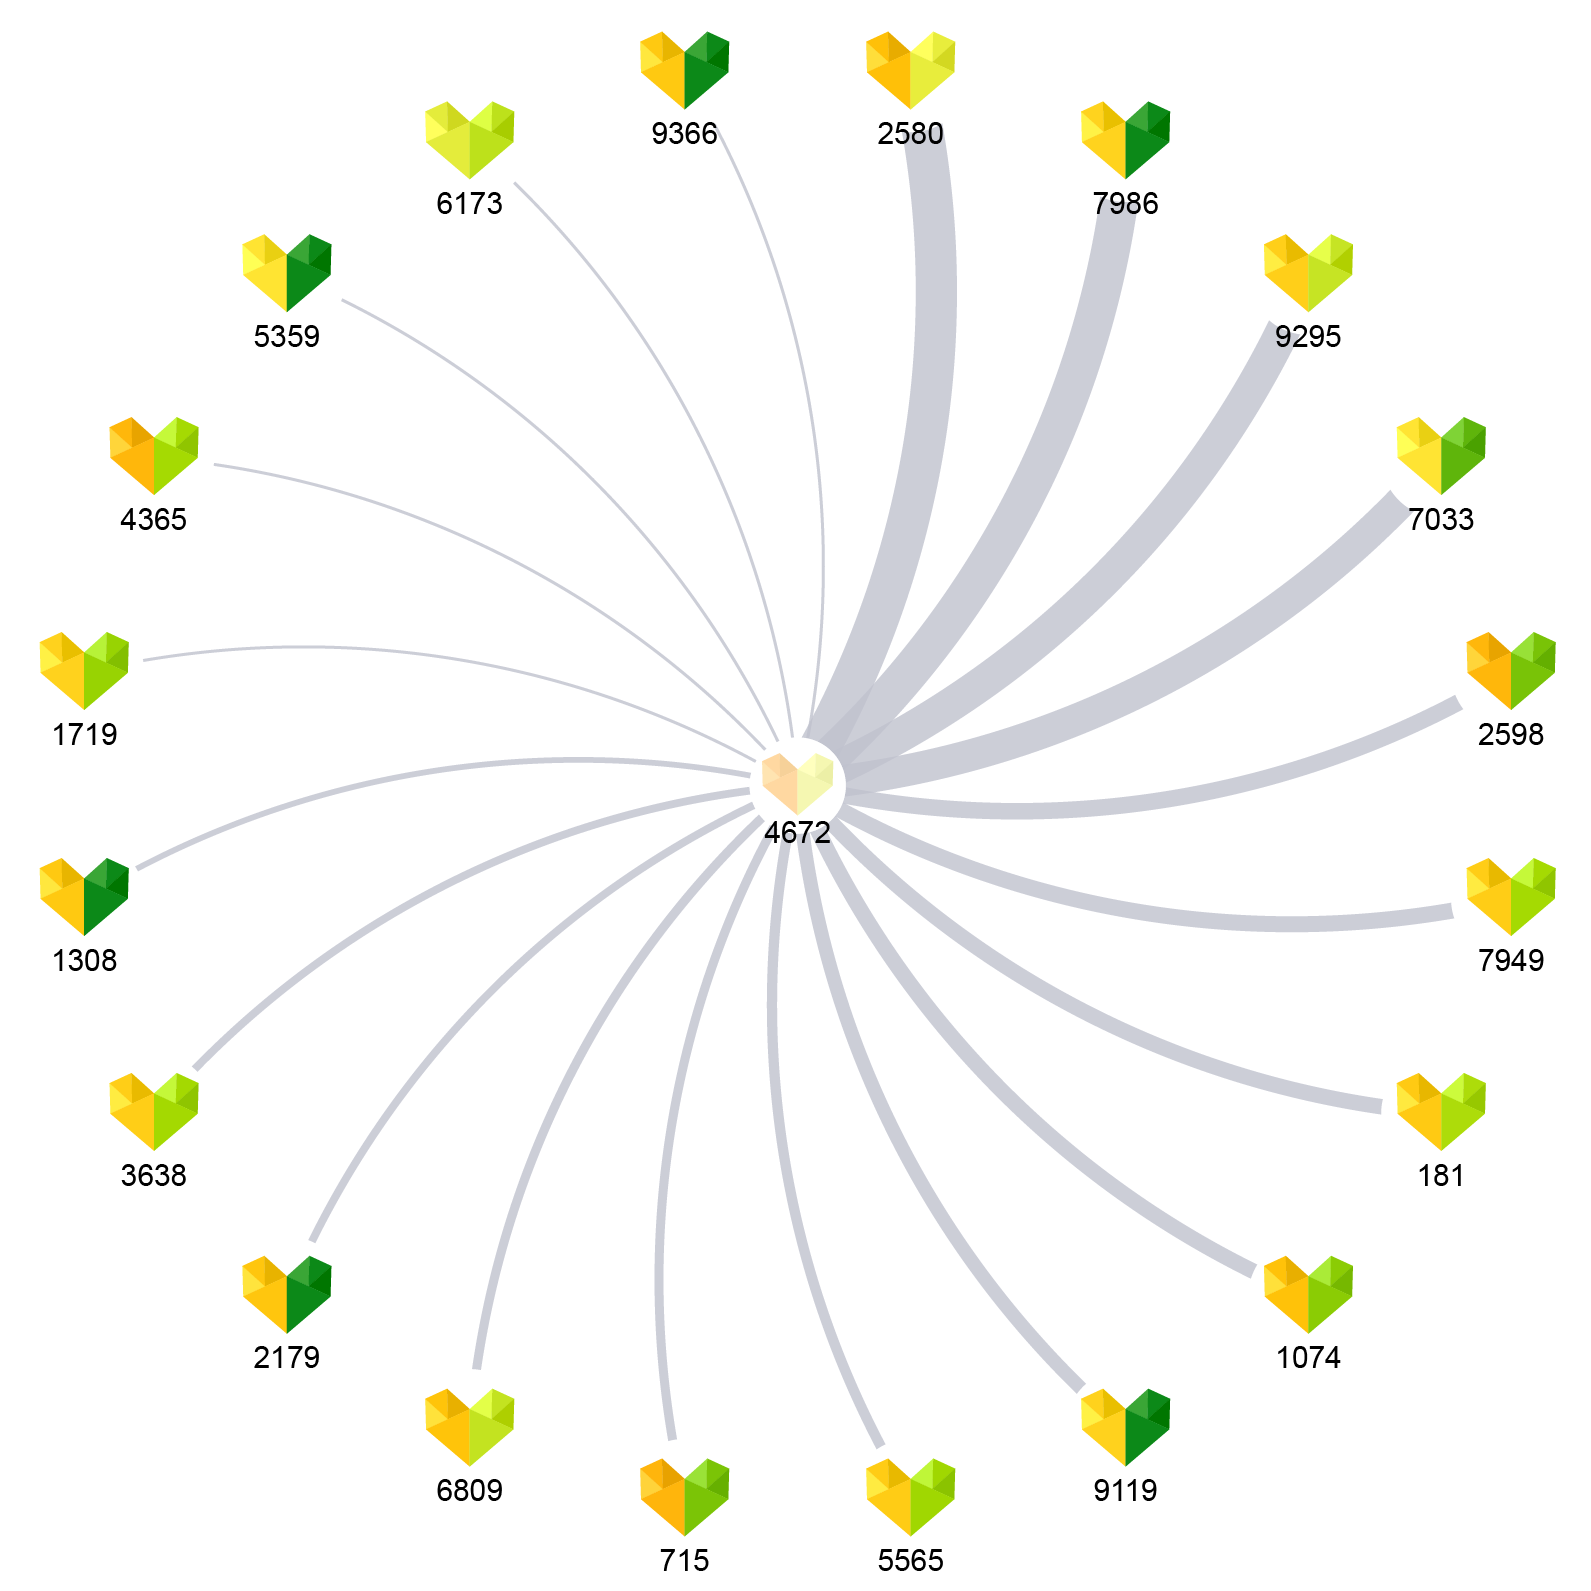
Constructing a patient sharing network
Records of 103 million visits to resident doctors in Austria in 2018.
Doctor specialty
Doctor location
Number of patient visits & patient IDs
Maximum capacity estimation via opening hours.
Opening hour information collected from herold.at
Assign median capacity of top 10% doctors to all doctors with similar opening hours.

Constructing a patient sharing network
Characteristics of selected specialities
| Speciality | Doctors | Opening hours / week | Patients per quarter |
|---|---|---|---|
| General medicine | 4967 | 19 (±6) | 2949 (±2246) |
| Internal medicine | 1058 | 22 (±6) | 1601 (±3424) |
| Psychiatry | 161 | 21 (±5) | 1056 (±1115) |
| Paediatrics | 336 | 21 (±6) | 2212 (±1788) |
| Dermatology | 290 | 21 (±4) | 2660 (±2179) |
| Radiology | 424 | 42 (±10) | 3759 (±4283) |
Patient relocation simulation (one speciality)
Initial condition: all patients have a doctor
1. Some doctors are removed to simulate a shock.
2. Each patient that lost their doctor selects a new doctor with probability p, where p ~ N patients shared with original doctor.
3. Each doctor accepts new patients until the capacity is filled.
4. Steps 2. and 3. are repeated for a maximum of 10 times or until each patient has a new doctor.
5. Patients that haven't found a new doctor are lost.
"Fast" shocks
Recovery after removing 15% of doctors

Recovery after removing 15% of doctors

Impact of fast shocks on different specialists

"Slow" shocks
Lost patients and capacity as doctors are removed

System limits: How many doctors can we remove?
Removing one doctor
in each time step until
1% of patients are lost.

System limits: How many doctors can we remove?
Removing one doctor
in each time step until
1% of patients are lost.

System limits: How many doctors can we remove?
Removing one doctor
in each time step until
1% of patients are lost.

System limits: How many doctors can we remove?
Removing one doctor
in each time step until
20% of capacity remains.

System limits: How many doctors can we remove?
Removing one doctor
in each time step until
20% of capacity remains.

System limits: How many doctors can we remove?
Removing one doctor
in each time step until
20% of capacity remains.

Summary of results
The patient sharing network encodes accessibility and doctor distribution.
Comprehensive health record data allows us to simulate a situation that is directly applicable to the situation in Austria.
Simulating fast and slow shocks allows us to find different limits of the healthcare system, differentiated by speciality and region.
Stress-testing the resilience of the Austrian healthcare system using agent-based simulation Kaleta & Lasser et al., Nature Communications (2022).
Check out our interactive healthcare resilience explorer!