Using agent-based simulations for real-world applications
Graz University of Technology | Complexity Science Hub Vienna
Jana Lasser | jana.lasser@tugraz.at | @janalasser
Spring 2020
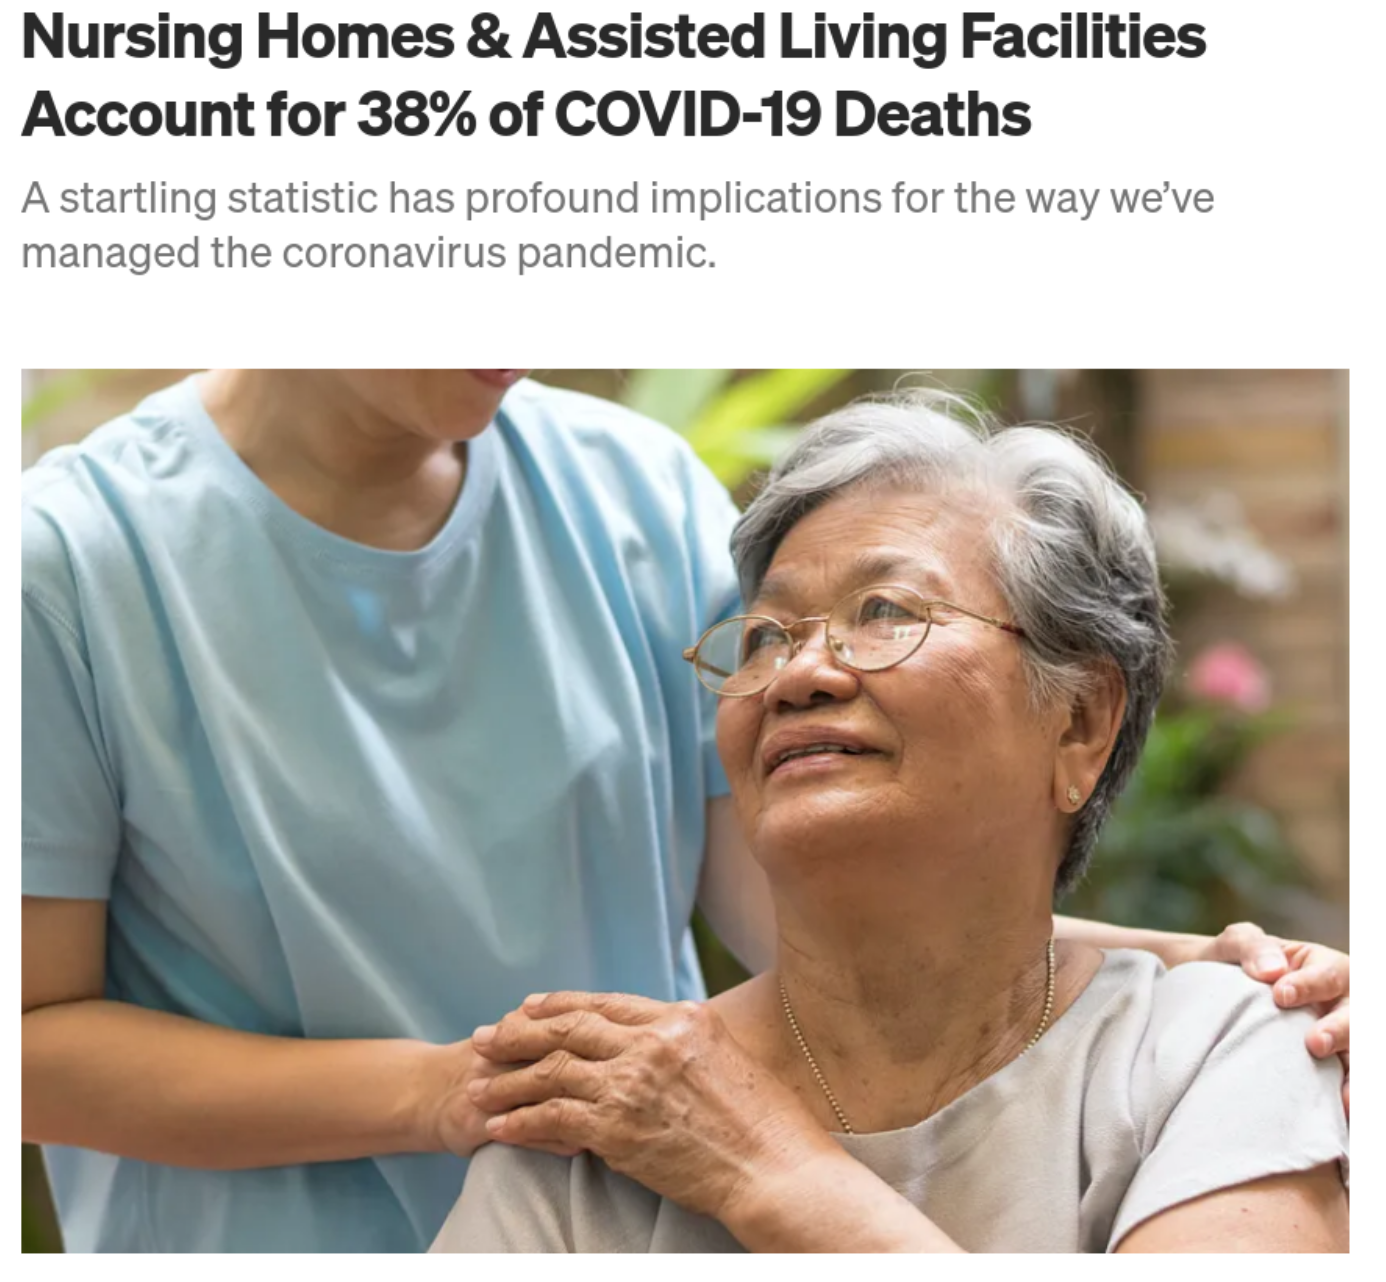
Source: https://freopp.org/the-covid-19-nursing-home-crisis-by-the-numbers-3a47433c3f70

12 nursing homes in Vienna and Lower Austria
between 35 and over 100 inhabitants
several severe outbreaks in early 2020
How can inhabitants be protected?
Model of a nursing home ward

Model of a nursing home ward

Model of a nursing home ward

Model of a nursing home ward

Model of a nursing home ward

What else do we know about the situation?
We know (roughly) how the virus behaves.
Residents are confined to the home, the virus enters via employees.
There are different testing technologies around.
We can test (and quarantine) individuals reactively or preventively.
We can test residents ("costly") and/or employees.
Research question: what is the best testing strategy?
Why agent-based simulation?
Compartment models (like SIR) assume homogeneous distributions and attributes. The reality in the home is very heterogeneous.
Space
The number of contacts (node degree) and contact intensity is not uniform. Different agent types have different contact patterns: Employees meet all inhabitants, inhabitants only meet selected inhabitants.
Time
Measures (and contact patterns) can vary in time: we only want to test the home population every X days.
Agent attributes
A variety of attributes can differ between agents and crucially influence infection transmission: immune status, epidemiological parameters (superspreaders), age, ...
Outline
(I) Building an agent-based model of infection spread in a nursing home to inform policy decisions.
(II) Testing different intervention scenarios in schools and universities.
(III) Agent-based modelling of healthcare system resilience.
Ingredients for an agent-based model of SARS-CoV-2

Ingredients for an agent-based model of SARS-CoV-2

Ingredients for an agent-based model of SARS-CoV-2

Ingredients for an agent-based model of SARS-CoV-2

Model of the infection
When is an agent infectious?
How infectious is an agent at a point in time?
When does an agent show symptoms?

Model of the infection

Walsh K. A., Jordan K., Clyne B., et al. SARS-CoV-2 detection, viral load and infectivity over the course of an infection: SARS-CoV-2 detection, viral load and infectivity. Journal of Infection (2020).
Model of the infection

Lasser, J. Small community SEIRX package v1.4.2. Python Package Index (2022).
Model of the infection

Lasser, J. Small community SEIRX package v1.4.2. Python Package Index (2022).
Model of the infection

Lasser, J. Small community SEIRX package v1.4.2. Python Package Index (2022).
Model of the infection

Lasser, J. Small community SEIRX package v1.4.2. Python Package Index (2022).
Model of the infection

Ferretti, L. et al. Quantifying SARS-COV-2 transmission suggests epidemic control with digital contact tracing. Science (2020).
Linton, M. N. et al. Incubation period and other epidemiological characteristics of 2019 novel coronavirus infections with right truncation: a statistical analysis of publicly available case data. Journal of Clinical Medicine (2020).
Lauer, S. A. et al. The incubation period of coronavirus disease 2019 (Covid-19) from publicly reported confirmed cases: estimation and application.. Annals of Internal Medicine (2020).
Contact network
Which other agents does an agent meet?
When do the contacts occur?
How intense are the contacts?

Contact types
| Agent types | Interaction | Duration | Proximity | Type |
|---|---|---|---|---|
| inhabitant - inhabitant | sharing a room | very long | very close | household |
| inhabitant - inhabitant | meals at same table | long | close | K1 |
| employee - inhabitant | caring for inhabitant | long | close | K1 |
| all - all | hallway meeting | short | far | K2 |
Contact network of a nursing home

Contact network of a nursing home

Contact network of a nursing home

Contact network of a nursing home

Contact network of a nursing home

Simulation of infection dynamics

Simulation of infection dynamics

Simulation of infection dynamics

How do we make sure that what we simulate reflects reality?
Calibration
Which are the free parameters in our model?
How do outbreaks look in reality?
Which parameter values reproduce the "real" outbreaks?

Simulation of infection dynamics

Which mechanisms influence the transmission probability?
Two agents meet: is there a transmission?

[1] He et al. 2020 Temporal dynamics in viral shedding and transmissibility of Covid-19.
Transmission probability p

[1] He et al. 2020 Temporal dynamics in viral shedding and transmissibility of Covid-19.
Transmission probability p

[1] He et al. 2020 Temporal dynamics in viral shedding and transmissibility of Covid-19.
Transmission probability p

[1] He et al. 2020 Temporal dynamics in viral shedding and transmissibility of Covid-19.
Transmission probability p

[2] Byambasuren, O. et al. 2020 Estimating the extent of asymptomatic Covid-19 and its potential for community transmission: systematic review and metaanalysis.
Transmission probability p

[1] He et al. 2020 Temporal dynamics in viral shedding and transmissibility of Covid-19.
Calibrating household Secondary Attack Rate (SAR)
Calibrating household Secondary Attack Rate (SAR)
Calibrating household Secondary Attack Rate (SAR)
Calibrating household Secondary Attack Rate (SAR)
Calibrating household Secondary Attack Rate (SAR)
Remaining free parameters

Empirical outbreak data

Circumstances at time of data collection:
no vaccinations, no masks, no testing, wild type virus.
Simulated outbreak dynamics

Create an ensemble of simulation runs.
Optimal contact intensity

Non-room contacts are 87% less likely to transmit an infection.
Tried to differentiate table & ward contacts: doesn't work.
No remaining free parameters

Intervention measures for nursing homes
Preventive testing
Tests of employees and/or inhabitants every X days
Positive agents and their close contacts are isolated
Try different testing technologies

Aim: find an optimal testing strategy (e.g. few infected inhabitants)
Infected inhabitants in different scenarios

Different test technologies & turnover times

Optimal testing strategy

Adding vaccinations to the mix
Vaccinations reduce infection and transmission probability.
A percentage of employees and/or inhabitants can be vaccinated.

Testing & vaccinations

Virus variants

Summary of results
Our agent-based simulation allowed us to develop an optimal testing strategy for nursing homes that could easily be adapted to changing circumstances.
Agent-based simulations are useful when things are inhomogeneous.
Heterogeneous contact patterns.
Complex intervention scenarios.
Time variation in contact patterns and measures.
Empirical data is key to making sure simulations reflect reality.
Modelling choices should be informed by domain experts.
Contact networks should be empirically measured or at least based on domain knowledge.
Simulation parameters have to be calibrated to empirical observations.
Agent-based simulations for protecting nursing homes with prevention and vaccination strategies Lasser et al., J. R. Soc. Interface (2021).
(II) Testing different intervention scenarios in schools and universities
Contact network of a primary school

Contact network of a primary school

Contact network of a primary school

Contact network of a primary school

Contact network of a primary school

Contact network of a secondary school

School model: additional model components
Infection dynamics involve children: age-dependence of transmission risk.
Additional measures: masks, room ventilation, cohorting.
Transmission risk in the school context

Assumption: q2 = q3 = qage.
Model qage as linear decrease in infection risk for every year younger than 18.
Transmission risk in the school context

Assumption: q2 = q3 = qage.
Model qage as linear decrease in infection risk for every year younger than 18.
Transmission risk in the school context
Assumption: q2 = q3 = qage.
Model qage as linear decrease in infection risk for every year younger than 18.
The data
536 clusters* with 3342 cases recorded in Austrian schools between
2020-08-31 and 2020-11-02 collected by AGES.
| Age | School type | Clusters | Cases |
|---|---|---|---|
| < 10 years | primary | 67 | 286 |
| 10-15 years | lower secondary | 180 | 762 |
| > 15 years | upper secondary | 116 | 388 |
| > 10 years | secondary | 70 | 810 |
| otherwise | inconclusive | 103 | 1097 |
*"school cluster": at least two cases of which at least one transmission ocurred in a school context.
Data available at https://doi.org/10.5281/zenodo.4706876
Cluster size distributions

Clusters in secondary schools are much larger than in other school types.
Student case distributions

Ratio of asymptomatic cases*

*Follow-up to exclude initially pre-symptomatic cases.
Conditions in autumn 2020
Error term to optimize

Simulations for all school types:
(-) Draw source cases from known distribution of teachers and students.
(-) Use known age-dependence of asymptomatic infections.
(-) Simulate with known conditions at data collection time.
Calibration of contact strength & age dependence

The minimum represents the optimal parameter combination.
Weight of non-household contact: 0.30 [0.26; 0.34]
Age dependence: -0.005 [-0.0225; 0.0], e.g. -0.5% per year younger than 18.
Intervention measures for schools
Situation: spring 2021, 80% vaccinated teachers, ~50% vaccinated children.
Aim: find optimal measure combinations
Preventive testing: teachers and/or students are tested 1x or 2x a week.
Cohorting: Only 50% of students are present, cohorts alternate.
Ventilation: Airing rooms for 10 min every hour.
Masks: teachers and/or students wear masks.

Results (delta)

Two measures are enough to prevent large outbreaks.
Results (delta)

Two measures are enough to prevent large outbreaks.
Results (delta)

Two measures are enough to prevent large outbreaks.
Results (delta)

Two measures on top of TTI are enough to prevent large outbreaks.
Results (delta)

Secondary schools need three measures on top of TTI or seasonal effects.
Comparison Delta vs. Omicron

Comparison Delta vs. Omicron

What about Universities?
We can re-use the calibration from schools but have no contact network.
Idea: use TU Graz online to re-construct the student contact network.

Contact network of TU Graz

Intervention measures for TU Graz
Is presence teaching feasible?
Occupancy reduction: lecture halls are occupied to 25%, 50% or 100% (blue dots, green dots).
Masks: students and lecturers all wear masks (or don't wear masks).
Vaccination: Almost everybody is vaccinated but Omicron evades immunity -> different vaccine effectiveness levels.

Results (Omicron)

Results (Omicron)

Results (Omicron)

Results (Delta)
Summary
(1) Nursing homes: keeping inhabitants safe without vaccinations
Agent-based simulations for protecting nursing homes with prevention and vaccination strategies Lasser et al. (2021).
(2) Schools: different measures for different school types
Assessing the impact of SARS-CoV-2 prevention measures in schools by means of agent-based simulations calibrated to cluster tracing data Lasser et al. (2022).
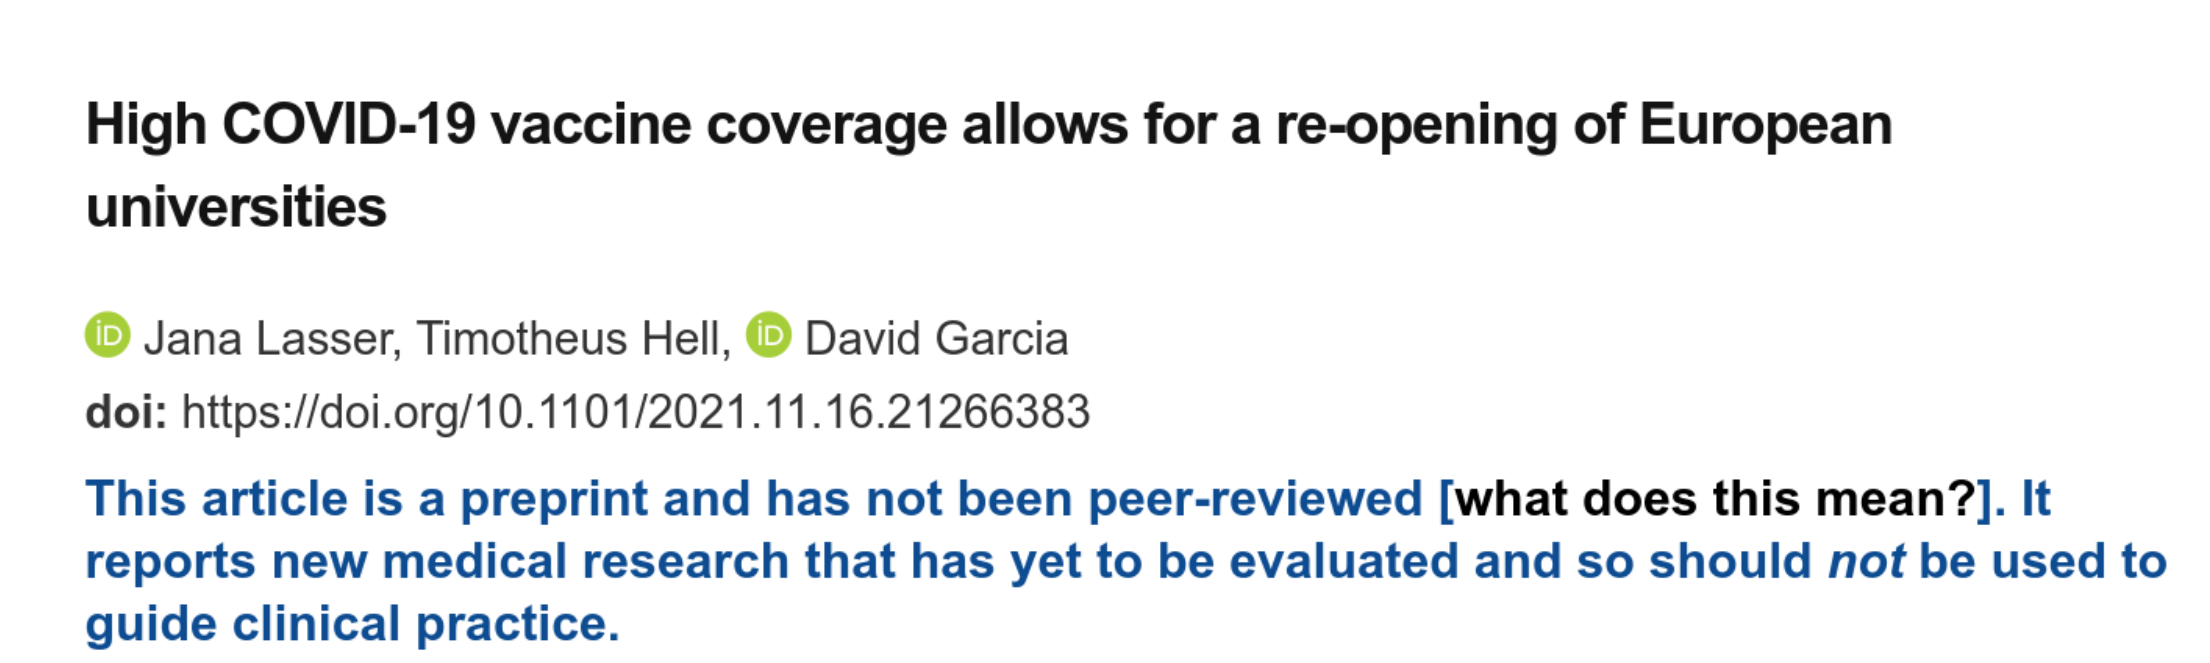
(3) Universities (TU Graz): presence teaching during Omicron?
Assessment of the effectiveness of Omicron transmission mitigation strategies for European universities using an agent-based network model Lasser et al. (2022).
Materials
(III) Agent-based modelling of healthcare resilience
Motivation
Resident doctors can be hard to find
aging population (retirement)
rural depopulation
short-term shocks (COVID-19)
Which regions and specialisations are
most at risk of severe shortages?
Image credit: Yurii Karvatskyi
Naive approach
Counting doctors per patient and region.
Issues with this approach:
heterogeneous doctor capacity
heterogeneous doctor distribution & accessibility
different scenarios: fast (COVID) vs. slow (retirement) shocks
More sophisticated approach
Encode accessibility and distribution of doctors in a patient sharing network and simulate patient dynamics for different scenarios.
Assumptions:
When patients loose their doctor, they are more likely to go to a doctor they had already visited in the past.
When patients don't find a doctor for a long time, they "drop out" of the (resident) healthcare system.
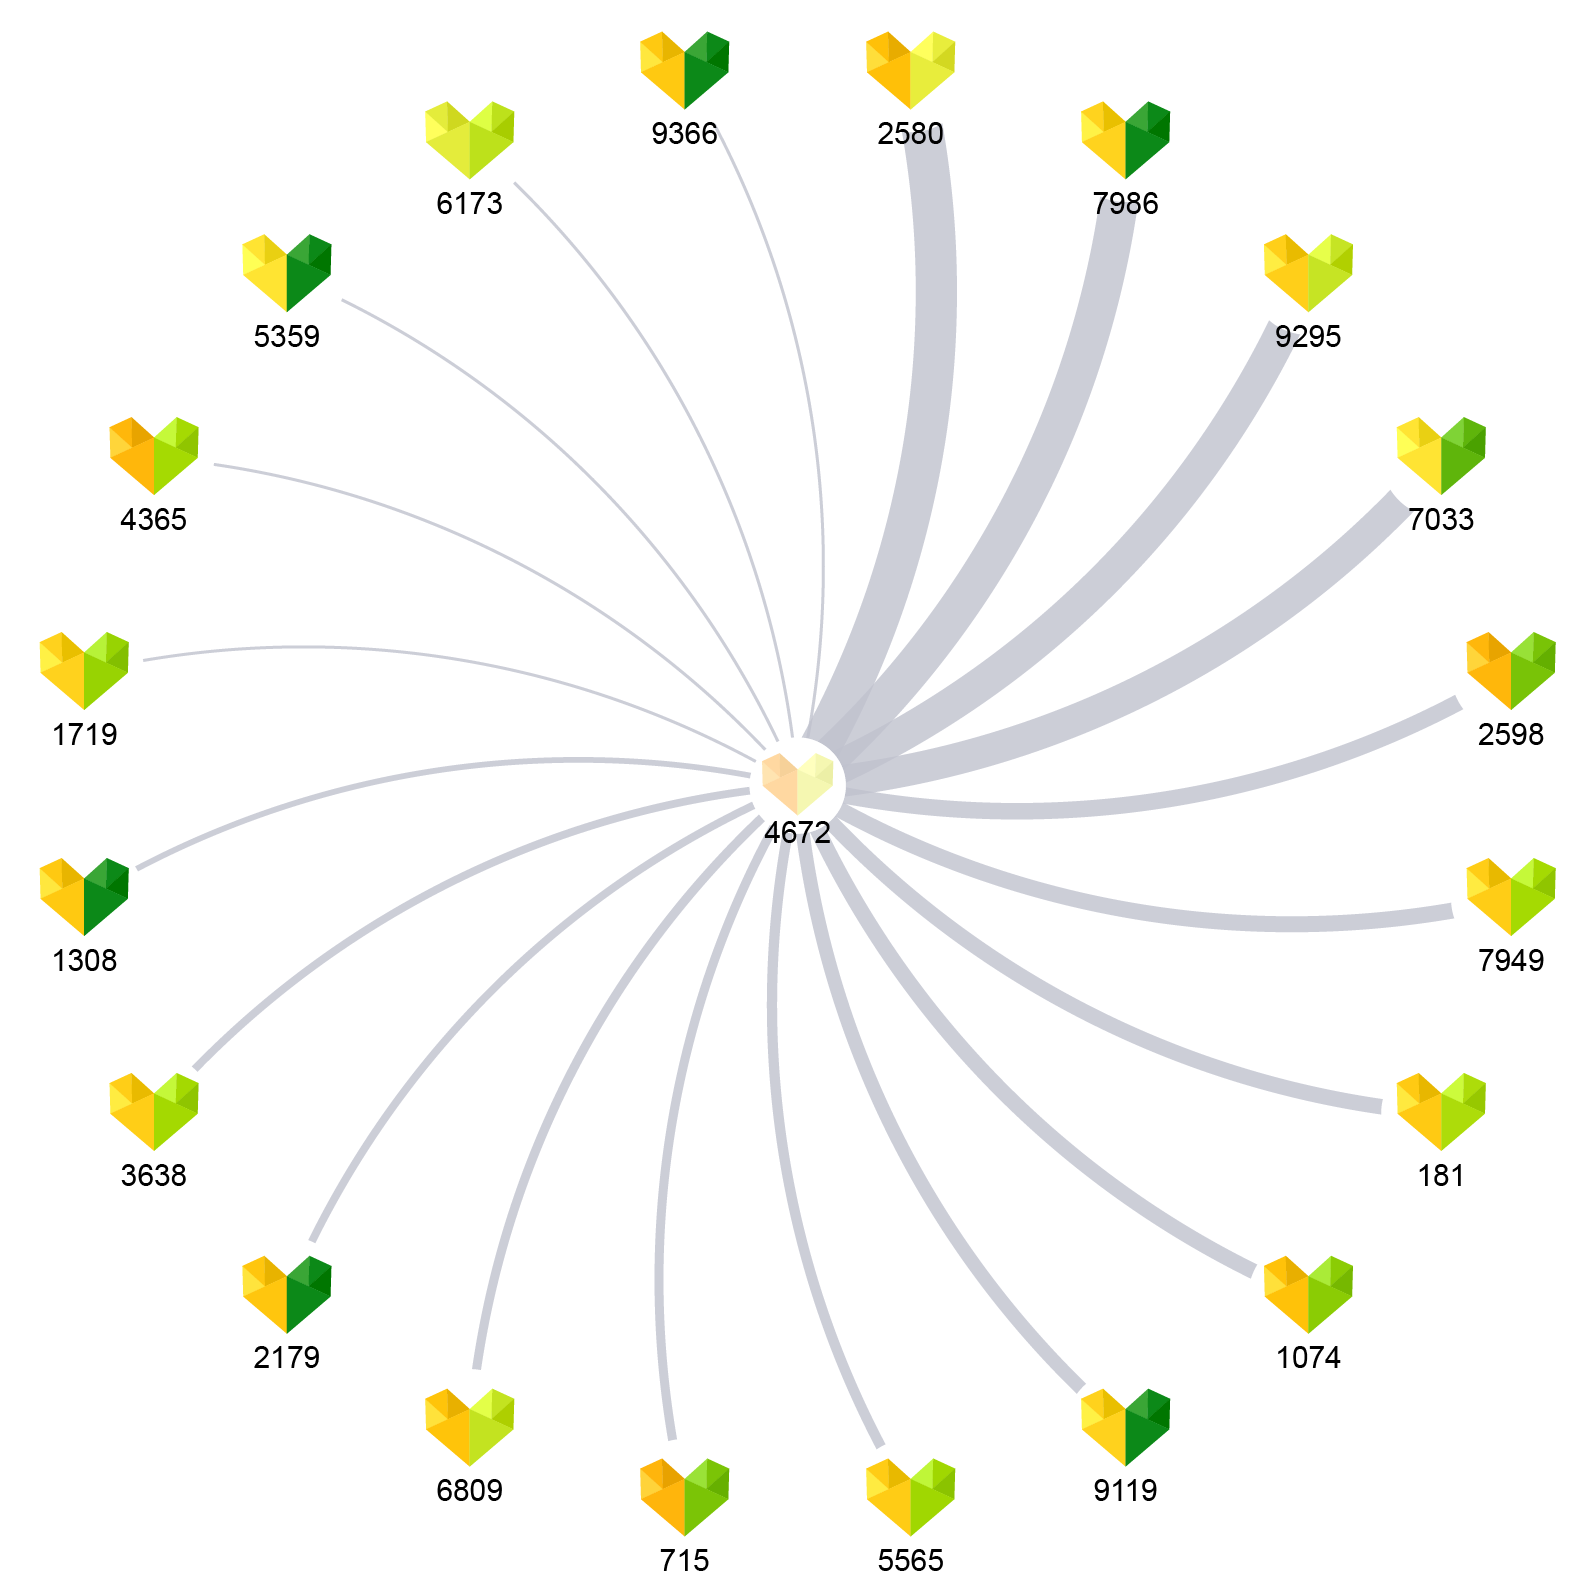
Constructing a patient sharing network
Comprehensive records of visits to resident doctors in Austria in 2018 aggregated with opening hour information from herold.at.
Characteristics of selected specialities
| Speciality | Doctors | Opening hours / week | Patients per quarter |
|---|---|---|---|
| General medicine | 4967 | 19 (±6) | 2949 (±2246) |
| Internal medicine | 1058 | 22 (±6) | 1601 (±3424) |
| Psychiatry | 161 | 21 (±5) | 1056 (±1115) |
| Paediatrics | 336 | 21 (±6) | 2212 (±1788) |
| Dermatology | 290 | 21 (±4) | 2660 (±2179) |
| Radiology | 424 | 42 (±10) | 3759 (±4283) |
Patient relocation simulation (one speciality)
Initial condition: all patients have a doctor
1. Some doctors are removed to simulate a shock.
2. Each patient that lost their doctor selects a new doctor with probability p, where p ~ N patients shared with original doctor.
3. Each doctor accepts new patients until the capacity is filled.
4. Steps 2. and 3. are repeated for a maximum of 10 times or until each patient has a new doctor.
5. Patients that haven't found a new doctor are lost.
Recovery after removing 15% of doctors

Recovery after removing 15% of doctors

Impact of large shocks on different specialists

How many doctors can we remove?
Removing one doctor in each time step until 1% of patients are lost.

How many doctors can we remove?
Removing one doctor in each time step until 1% of patients are lost.

How many doctors can we remove?
Removing one doctor in each time step until 1% of patients are lost.

Summary of results
The patient sharing network encodes accessibility and doctor distribution.
Comprehensive health record data allows us to simulate a situation that is directly applicable to the situation in Austria.
Simulating fast and slow shocks allows us to find different limits of the healthcare system, differentiated by speciality and region.
Stress-testing the resilience of the Austrian healthcare system using agent-based simulation Kaleta & Lasser et al., Nature Communications (2022).
Final thoughts
Agent-based simulations are a powerful tool to investigate complex systems.
Constructing simulations such that they are useful for real-world inferences requires a lot of domain knowledge and data.
Collaboration with domain experts is key for impactful research.
Slides
